
MELI 3Q24: Strategic Credit Growth and Logistics Investments Dampen Short-Term Profitability
We remain optimistic about MELI’s financial and business risk profile.


Executive Summary
We maintain our Outperform recommendation on MercadoLibre, with a preference for MELI 2.375% 2026 bonds. We remain optimistic about MELI’s financial and business risk profile. If the company achieves investment-grade status in the short term, we believe MELI’s fundamental strengths are already reflected in current spreads. However, we see around 10 bps of incremental upside from a technical bid.
For EM investors, we prefer MELI 2.375% 2026 notes, which present a potential spread compression of 10-25 basis points. These bonds trade wide relative to the EM BBB and LatAm BBB Indices, offering a more favorable risk-return profile than MELI 3.125% 2031 notes, which are currently trading tight against the same benchmarks.
For US investors, MELI's risk-reward symmetry is particularly compelling. The 2031 bonds trade wide to the broader US Index, yielding 1.0 percentage points higher than comparable global e-commerce and fintech peers. We believe MELI’s geographic diversification, strong liquidity, healthy credit metrics, and positive outlook partially offset the risks linked to its LatAm exposure.
MELI’s leadership in Latin American e-commerce and fintech, alongside a strong reputation for managing regional economic and political challenges, gives the company a competitive edge. Its diversified offerings enhance customer retention and growth, while a presence in 18 countries strengthens its business profile. A commitment to a conservative balance sheet, strong operational performance, and solid credit metrics further supports MELI’s creditworthiness.
Weaker-than-expected 3Q24 results. MELI's strategic investments in credit growth and logistics expansion significantly impacted profitability, with the EBIT margin contracting by 950 bps year-over-year, reversing two years of consistent EBIT growth. Despite short-term margin pressures, we see substantial value in MELI's credit offerings, which enhance customer integration into Mercado Pago and Commerce services. However, we expect these investments to pay off in the medium term.
Commerce revenue increased by 47.5% YoY to $3.1 billion in 3Q24. This growth was driven by a 13.6% YoY rise in GMV, reaching $12.9 billion for the quarter. Management highlighted that Commerce has achieved significant growth by successfully transitioning offline commerce to online platforms, resulting in a 20.9% YoY and 7.4% QoQ increase in unique buyers, which totaled 60.8 million in 3Q24. The Commerce take rate also expanded by 5.6 percentage points YoY, reaching 24.3% in 3Q24 compared to 18.7% in 3Q23 (2Q24: 23.5%).
Fintech revenues reached $2.2 billion in 3Q24, marking a 20.8% YoY and 3.3% QoQ increase from $1.8 billion. TPV rose 34.0% YoY and 9.4% QoQ, with acquiring TPV up 21.3% YoY and 6.8% sequentially, despite FX headwinds across all markets. Mercado Pago reached 56.2 million active users in 3Q24. Mercado Crédito’s portfolio expanded significantly to $6.0 billion in 3Q24, with originations increasing 76.5% YoY and 15.7% sequentially. The credit card segment remains a key growth driver, with the portfolio expanding 171.6% YoY and 27.5% QoQ to $2.3 billion. Fintech’s take rate decreased to 4.3% in 3Q24 from 4.8% in 3Q23 (2Q24: 4.5%).
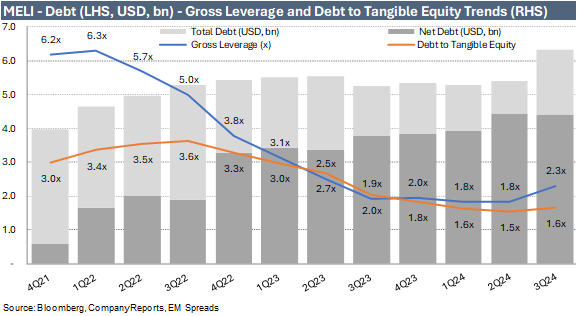
MELI ended the quarter with $6.3 billion in total debt, up $921 million sequentially. Net debt reached $1.9 billion at the end of the quarter, marking a significant increase from $976 million in June 2024. Gross leverage rose to 2.3x as of September 2024, up from 1.8x in June, while net leverage increased to 0.7x from 0.3x. Adjusted interest coverage declined to 4.4x in September 2024 from 4.8x in June.
The credit story is constrained by (1) the competitive landscape, with potential for large international competitors to increase focus on Latin America; (2) regulatory risk, particularly within fintech as the industry expands in the region; (3) country risk, given that the majority of the company’s revenues are generated in high-risk countries; and (4) credit risk, as MELI operates in a high-risk credit market segment, concentrating on consumer credit/credit cards and small and medium-sized businesses.
Trade Recommendation
We continue to view MELI as an attractive emerging market credit story. The company’s leadership in Latin American e-commerce and fintech sectors positions it well to capture value and manage operational risk effectively. MELI benefits from a strong operating profile, solid geographic diversification across the Latin American region, and a healthy liquidity position supported by substantial cash generation. Given its competitive advantage, we are positive on the company’s fundamentals and expect healthy growth and positive operating performance, likely resulting in improved credit metrics.
Regarding the weaker-than-expected 3Q24 results, MELI made significant strategic investments in credit growth and logistics expansion, which had a notable negative impact on profitability. The EBIT margin contracted by 950 bps YoY, reversing two years of consistent EBIT growth. Despite this sharp decline, management remains optimistic about these investments, and key operating metrics such as GMV, past dues, and active users showed improvement. Although profitability is under pressure, we see considerable value in MELI’s credit offerings and their role in integrating customers into the broader suite of Mercado Pago and Commerce services. While we expect short-term margin pressures to continue, MELI’s expansion in credit and logistics is set to strengthen its competitive position and enhance operating performance over the medium term.
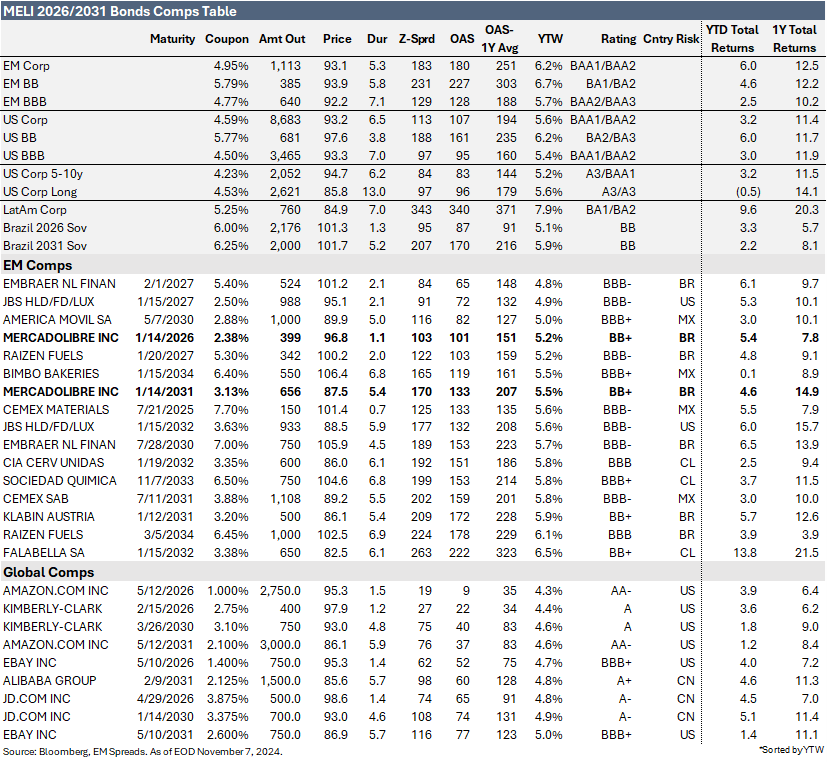
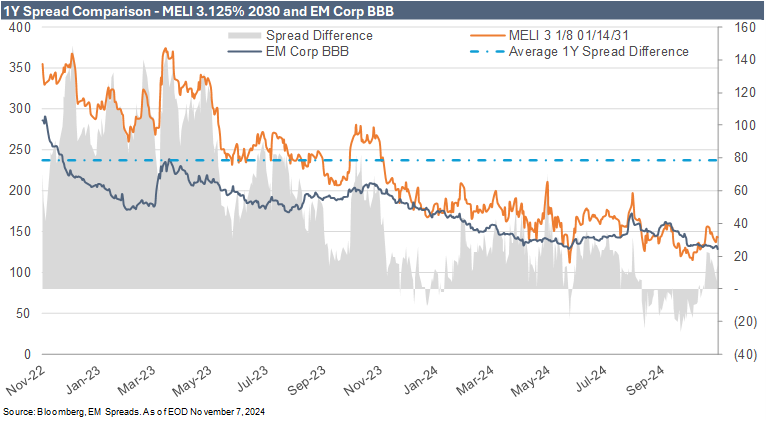
During the quarter, Fitch upgraded MELI’s credit rating to investment grade at BBB-, with a stable outlook. The company remains rated one notch below investment grade by both S&P Ratings and Moody’s, with S&P revising MELI’s outlook to positive in June. If either agency upgrades MELI’s credit rating to investment grade, we would expect a technical bid driven by its inclusion in investment-grade indices. Currently, with MELI 3.125% 2031 notes trading at 143 bps, the spread difference between the notes and the EM BBB Index is 14 bps, which is aligned with the 1-year average spread difference but 64 bps below the 2-year average of 79 bps, though still wider than the recent 2-year low of -26 bps on September 27, 2024. Year-to-date, the spread difference between 2031 notes and the EM BBB Index has ranged from -26 bps to 70 bps, placing current spreads significantly closer to the tighter end of this range. In our view, this indicates that the potential technical upside is largely priced into current spreads. Consequently, we expect around 10 bps of incremental upside from the technical bid at these levels if the company achieves investment-grade status. We believe most of the company’s fundamental strengths are already reflected in the pricing.
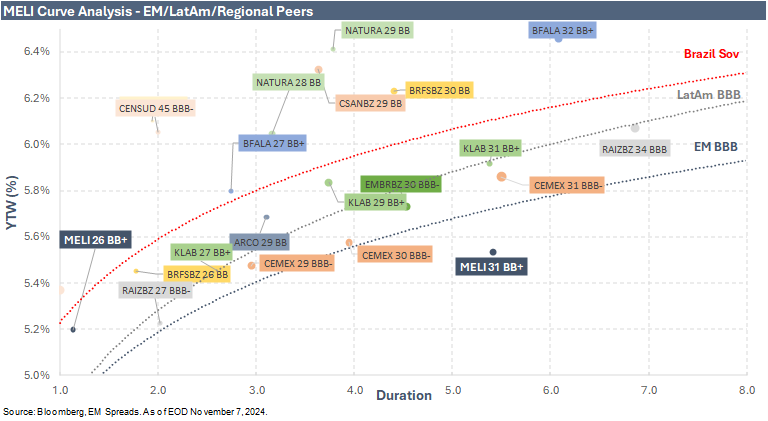
At current spread levels, we prefer MELI (Ba1/BB+/BBB) 2.375% 2026 bonds, yielding 5.2% for a 1.1-year duration, over MELI 3.125% 2031 bonds, yielding 5.5% for a 5.4-year duration. The broader EM Index yields 6.2%, the EM BB Index yields 6.7%, and the EM BBB Index yields 5.7%. We find the 2026 bonds more attractive than the 2031 bonds, as the former trade wider than the Latin American BBB and EM BBB curves, while the 2031 notes trade tighter than these benchmarks. However, neither bond trades tighter than the Brazilian Sovereign curve, which was not the case for the 2026 bonds when we published the 2Q24 results in early August 2024. This preference is further supported when compared to BBB- rated peers, such as EBBRBZ (BBB-/BBB-) 2027 notes yielding 4.8% for a 2.1-year duration, and JBSSBZ (Baa3/BBB-/BBB-) 2027 notes yielding 4.9% for a 2.1-year duration.
In assessing the current risk/return profile of the 2031 notes, we find that the existing prices do not sufficiently account for MELI’s inherent risks, such as operating in Latin America with significant exposures to high-risk countries like Argentina and Brazil. Additionally, the current spread levels do not adequately compensate for the combined risks of generating all revenues in domestic Latin American currencies, exposure to regulatory challenges, a potentially more competitive landscape, and ongoing EBIT margin compression due to strategic investments. Given these considerations, we prefer MELI 2.375% 2026 bonds. We are somewhat uncomfortable with the current spread levels on MELI 3.125% 2031 bonds, which trade tight compared to the LatAm and EM indices and regional peers, while MELI 2026 notes trade wide relative to these benchmarks and could benefit from a technical bid if MELI achieves investment-grade status.
MELI's bonds present a notably compelling risk-reward profile compared to the broader US market and global peers in the e-commerce and fintech sectors. The broader US Index yields 5.6%, while the US BBB Index yields 5.4%. This makes MELI's 2026 and 2031 notes relatively attractive, with yields of 5.2% and 5.5%, respectively. In terms of valuation relative to global peers, MELI’s 2031 notes appear wide compared to AMZN’s (A1/AA/AA-) 2031 bonds, which yield 4.6% for a 5.9-year duration; EBAY’s (Baa1/BBB+/BBB+) 2031 notes, yielding 5.0% for a 5.7-year duration; and BABA’s (A1/A+/AA-) 2031 bonds, yielding 4.8% for a 5.7-year duration. Similarly, MELI’s 2026 bonds, yielding 5.2%, stand out against peers like AMZN’s 2026 bonds, which yield 4.3% for a 1.5-year duration; EBAY’s 2026 notes, yielding 4.7% for a 1.4-year duration; and JD’s (A3/A-) 2026 bonds, yielding 4.9% for a 1.4-year duration.
For investors comfortable with this dynamic, we view MELI as an attractive option for picking up additional yield in the e-commerce and fintech sectors.
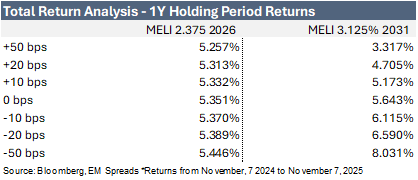
Total Return Analysis
3Q24 Operating Performance
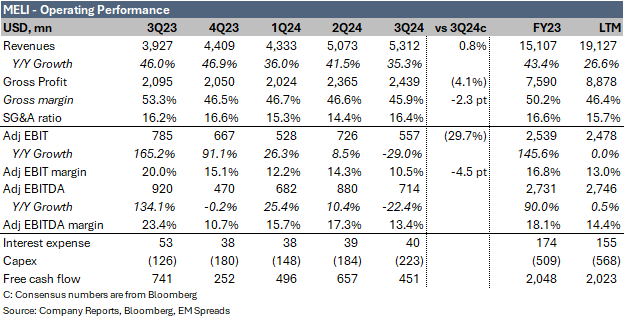
MercadoLibre (Ba1/BB+/BBB) reported a 35.3% YoY increase in 3Q24 revenues (FX-neutral: 103%), rising to $5.3 billion from $3.9 billion in 3Q23, despite FX headwinds in Brazil and Mexico. Both the Commerce and Fintech sectors contributed to this growth, with revenues up 47.5% YoY and 20.8% YoY, respectively. The Commerce segment's growth was driven by a 13.6% YoY increase in gross merchandise volume (GMV), while Fintech’s total payment volume (TPV) grew by 7.3% YoY. Brazil, Mexico, and Argentina delivered strong results, with revenue growth of 45.2% YoY, 48.3% YoY, and 25.2% YoY, respectively. However, revenues were only 0.8% above market consensus expectations.
In 3Q24, gross profit reached $2.4 billion, a 16.4% increase from $2.1 billion in 3Q23. The gross margin contracted by 743 bps, dropping to 45.9% from 53.3%, primarily due to the 1P mix effect and increased investments in logistics. The cost of goods sold rose significantly faster than revenue, up 56.8% YoY to $2.9 billion.
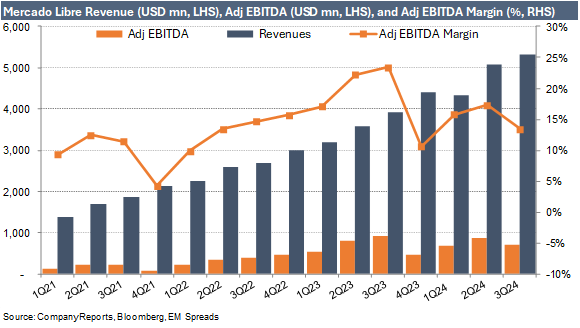
MELI’s 3Q24 EBIT was $557 million, down significantly by 29.0% YoY and 23.3% sequentially from $785 million in 3Q23 and $726 million in 2Q24. The EBIT margin contracted by 950 bps to 10.5% from 20.0%, coming in 450 bps below market consensus. This margin compression was primarily driven by strategic investments, including MELI’s expansion in its credit card business, which increased upfront provisions and contributed the most significant margin decline (-340 bps YoY). The company accelerated origination across all credit products and shifted its credit mix toward credit cards. The EBIT margin was also impacted by higher COGS (-220 bps) and G&A expenses (-110 bps), as well as by the reclassification of Mercado Pago interest income and expense (-180 bps) and shipping updates (-100 bps). 3Q24 adjusted EBITDA declined 22.4% YoY and 18.9% QoQ to $714 million from $920 million in 3Q23 and $880 million, with the adjusted EBITDA margin decreasing by 1,000 bps to 13.4% from 23.4%. G&A was negatively affected by a one-off expense of approximately $42 million related to discounts for clients who settled their credit early. Excluding this one-off, EBIT would still have been down 23.7% YoY, and EBITDA would have declined by 17.8% YoY.
Macro Trends
Despite MELI’s presence across 18 countries, the company generated 95.5% of its 2023 revenues in Brazil, Argentina, and Mexico. From 2017 to 2023, Brazil contributed an average of 57.1% of total revenues, Argentina 24.2%, and Mexico 13.3%. Consequently, these economies are key drivers of MELI’s operating performance. Given Brazil and Argentina’s economic volatility and history of political uncertainty, we closely monitor their macroeconomic outlook.
On the macroeconomic front, aside from an anticipated rebound in Argentina—with GDP per capita projected to rise by 3.0% in 2025—growth in Brazil and Mexico is expected to be modest, at 2.0% and 1.4%, respectively. Unemployment is anticipated to remain manageable, inflation is expected to remain stable in Brazil and Mexico, and Argentina is projected to see significant improvement in inflation rates. Mexico’s economy remains relatively resilient, bolstered by low unemployment and the positive impact of nearshoring trends that continue to attract foreign investment. However, the fiscal deficit above 5% in 2024 remains a concern. Milei’s shock therapy strategy in Argentina appears to yield positive results. The country maintains steady trade and fiscal surpluses, and the central bank’s balance sheet has improved significantly. Consumer confidence in Argentina has also rebounded notably from December lows. Brazil’s economic activity has shown surprising strength, with a tightening labor market in September that signals potential inflationary pressures, impacting growth prospects. Meanwhile, across Latin America, fiscal imbalances could hinder the region’s efforts to control inflation as governments increase public spending to stimulate growth.
3Q24 Segment Results
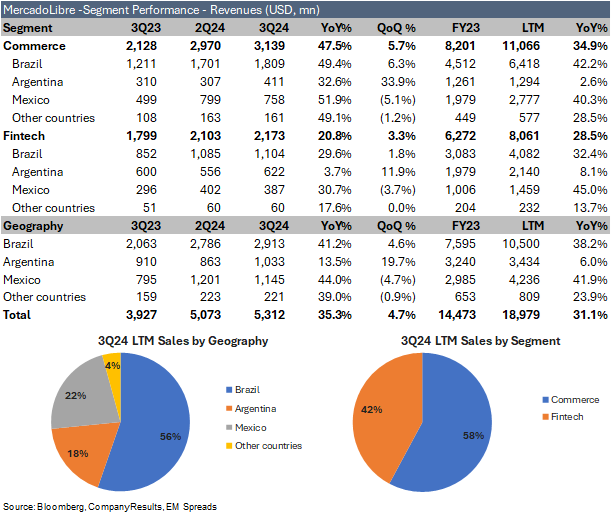
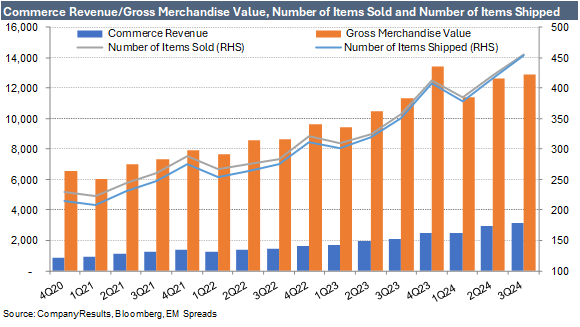
Commerce revenue, accounting for 58% of LTM total revenues, increased by 47.5% YoY to $3.1 billion in 3Q24. This growth was driven by higher GMV, which rose 13.6% YoY to $12.9 billion in the quarter. Items sold reached 456 million, a 27.7% increase YoY, while items shipped totaled 453 million, up 29.4% YoY. Management noted that Commerce has experienced significant growth by effectively transitioning offline commerce to online platforms, leading to a 20.9% YoY and 7.4% QoQ rise in unique buyers, reaching 60.8 million in 3Q24. This growth was further supported by initiatives such as installation appointments for auto parts, bulk purchase discounts in apparel, virtual try-on features for makeup, and dynamic pricing tools for sellers.
Geographically, Commerce revenues were primarily driven by Brazil, which saw a 49.4% YoY increase and a 6.3% QoQ increase to $1.8 billion. Mexico generated $758 million in Commerce revenues in 3Q24, representing a 51.9% YoY increase but a 5.1% sequential decline. Commerce revenues in Argentina reached $411 million, reflecting a 32.6% YoY increase and a notable 33.9% QoQ increase as consumption trends improved. Brazil continues to stand out with FX-neutral GMV growth of 34% YoY in 3Q24, while GMV in Mexico and Argentina rose 30% YoY and 27% YoY, respectively.
MELI has been expanding its logistics network to enhance the user experience for buyers by enabling faster shipping times and reducing late deliveries. During the quarter, the company opened five fulfillment centers in Brazil and one in Mexico. Although new facilities can pressure margins in the short term, they are central to MELI’s long-term growth strategy. In 3Q24, the company delivered 134.6 million packages on the same or next day, a 15.7% YoY and 5.7% sequential increase. However, MELI’s fulfillment network usage declined by 3.0 percentage points YoY and 2.0 percentage points sequentially, partly due to the increase in Meli Delivery Day and other slower shipping options, as more users chose a slower method for lower cost. The advertising business penetration increased to 2.0% of GMV in the quarter, up from 1.7% YoY and unchanged sequentially. The Commerce take rate expanded by 5.6 percentage points YoY to 24.3%, compared to 18.7% in 3Q23 (2Q24: 23.5%). Notably, 4.0 percentage points of this improvement were due to higher shipping revenues, where MELI is considered the principal, with revenues recognized on a gross basis. Increased advertising penetration also contributed to the improved Commerce take rate.
Fintech revenues, representing 42% of LTM total revenues, reached $2.2 billion in 3Q24, up 20.8% YoY and 3.3% QoQ from $1.8 billion in 3Q23 and $2.1 billion in 2Q24. Geographically, growth in Fintech revenues was led by Mexico and Brazil, with increases of 30.7% and 29.6% YoY, respectively, while Argentina saw a more modest 3.7% YoY increase. TPV rose 34.0% YoY and 9.4% QoQ to $50.7 billion, with acquiring TPV up 21.3% YoY and 6.8% sequentially to $36.0 billion, despite FX headwinds across all markets.
Mercado Pago reached 56.2 million active users in 3Q24, up from 41.5 million in the same period in 2023 (2Q24: 52.0 million). All major markets demonstrated strong growth, with Brazil expanding ahead of the average. Argentina also showed positive momentum, driven by the strength of the Mercado Pago value proposition in a highly inflationary environment. The expansion of MELI’s credit offerings, particularly the Mercado Pago credit card, along with growing awareness of the company’s remunerated accounts, has supported this improvement.
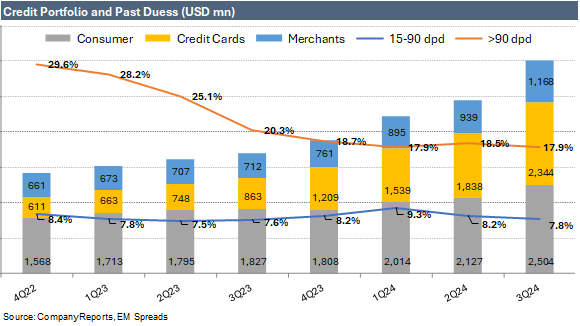
Mercado Credito’s portfolio grew significantly to $6.0 billion in 3Q24, up from $3.4 billion in 3Q23 and $4.9 billion in 2Q24, with originations rising 76.5% YoY and 15.7% sequentially to $6.4 billion. During the quarter, the company issued loans to over 25 million users. The credit card segment remains a key growth driver, with the credit card portfolio expanding 171.6% YoY and 27.5% QoQ to $2.3 billion. MELI remains committed to its scoring models, which give management confidence to scale the credit card segment at this accelerated pace. Despite short-term margin pressure, MELI confirmed that scaling the credit card portfolio is strategically important as it supports Mercado Pago’s adoption as a primary account. However, the net interest margin after losses (NIMAL), calculated as credit revenues minus provisions for doubtful accounts and funding costs, declined to 24.2% in 3Q24 from 37.4% in 3Q23 and 31.1% in 2Q24. This decline was primarily due to the increased share of lower-NIMAL credit cards in the portfolio, which rose to 37.5% from 23.0% in the same period last year (1Q24: 34.6%), a shift toward lower-risk users with lower-margin loans, and a faster pace of originations requiring higher upfront provisions.
Mercado Fondo's total assets under management (AUM) grew significantly to $8.0 billion in 3Q24, up from $5.5 billion in 3Q23 and $6.6 billion in 2Q24. Mercado Fondo’s value proposition emphasizes its remunerated account, which offers immediate interest on deposits with instant liquidity. It is an especially valuable feature in high-inflation countries, where money in an account would otherwise quickly lose value. Management noted that this strategy is central to the company’s value proposition, serving as an entry point for broader engagement with Mercado Pago. This approach has significantly boosted both user numbers and AUM, with Brazil showing the fastest AUM growth among the three main geographies. MELI’s 15-90 day non-performing loans (NPL) decreased sequentially to 7.8% in 3Q24 from 8.2% in 2Q24 but increased slightly from 7.6% YoY. NPLs over 90 days improved to 17.9% in 3Q24 from 18.5% in 2Q24 and 20.3% in 3Q23, primarily due to a shift towards lower-risk cohorts in the consumer and merchant portfolios. The largest component of the credit portfolio is consumer credit, totaling $2.5 billion or 41.6%, followed by credit cards at $2.3 billion or 39.0%, and merchant credit at $1.2 billion or 19.4% of the credit portfolio.
Fintech’s take rate decreased to 4.3% in 3Q24 from 4.8% in 3Q23 (2Q24: 4.5%), primarily due to a decline in financial income (-25 bps), partly driven by lower rates in Argentina. Additionally, the upmarket shift in Brazil put pressure on transactional fees (-12 bps) and net financing fees (-13 bps).
Financial Profile
MELI ended 3Q24 with $6.3 billion in total reported debt, up $921 million sequentially from $5.4 billion as of June 2024 (December 2023: $5.3 billion). This total includes $971 million in leasing obligations as of September 2024. Of the reported debt, $2.5 billion was classified as short-term, with an additional $201 million in short-term leasing obligations. Cash and cash equivalents stood at $2.2 billion, a decrease of $656 million sequentially but relatively stable year-over-year. Short-term investments, excluding time deposits and foreign government debt securities held in guarantee, decreased by $162 million to $1.1 billion as of September 2024 (December 2023: $1.2 billion). Long-term investments, excluding those held in VIEs for securitization transactions and equity securities held at cost, increased by $808 million to $1.2 billion as of September 2024 (December 2023: $81 million). Consequently, net debt reached $1.9 billion at the end of the quarter, a $931 million sequential increase from $976 million as of June 2024 (December 2023: $1.5 billion). During the quarter, MELI did not allocate capital to acquisitions, share repurchases, or dividends.
Adjusted EBITDA of $714 million in 3Q24 comfortably covered $223 million in capex and $40 million in interest expense, resulting in $451 million of free cash flow (3Q23: $741 million). After accounting for $335 million in working capital changes and $123 million in income tax, net free cash flow totaled $663 million. Operating cash flow was robust at $1.6 billion in 3Q24, up from $941 million in the same period last year, comfortably covering the $223 million in capex, resulting in a free operating cash flow of $1.4 billion.
The adjusted free cash flow metric, which MELI began disclosing in 2Q24, was a $203 million outflow, bringing the YTD total to $653 million compared to $838 million in 1H24. Management attributed the adjusted free cash flow consumption to the accelerated growth of the credit portfolio.
Capex in 3Q24 was $223 million, up from $126 million in 3Q23 and $184 million in 2Q24. This brought total capex for 9M24 to $555 million compared to $329 million in 9M23. Capex's percentage of revenues was 4.2% in the quarter, remaining relatively stable at 4.1% in 3Q23 but up from 3.6% in 2Q24.
MELI’s interest expense was $40 million in 3Q24, down from $53 million in the same period last year but slightly up sequentially from $39 million in 2Q24. Notably, MELI reclassified Mercado Pago's interest income and expense lines from below income from operations to above income from operations, significantly reducing reported interest expenses. Without this reclassification, the 2023 interest expense would have been $378 million, compared to $174 million with the reclassified items. The difference between interest expense and cash interest paid was substantial in 2023, with cash interest paid reported at $608 million. The company does not disclose cash interest paid on a quarterly basis.
Our analysis monitors the debt-to-tangible equity ratio to better assess MELI’s growing credit risk exposure. In 3Q24, tangible equity rose to $3.8 billion, up from $3.5 billion in 2Q24 (December 2023: $2.9 billion). However, the debt-to-tangible equity ratio increased to 1.6x as of September 2024, compared to 1.5x as of June 2024.
As a result, key credit metrics were primarily impacted by lower EBITDA and increased debt during the quarter:
Gross leverage increased to 2.3x as of September 2024 from 1.8x as of June 2024 (December 2023: 2.0x)
Net leverage deteriorated to 0.7x as of September 2024 from 0.3x as of June 2024 (December 2023: 0.6x)
Adjusted cash interest coverage decreased to 4.4x in 3Q24 from 4.8x in 2Q24 (4Q23: 4.5x)
Debt to tangible equity was 1.6x as of September 2024, up from 1.5x as of June 2024 (December 2023: 1.8x)
Liquidity
MELI’s liquidity remains healthy. The company has $2.5 billion in short-term debt, covered by $3.7 billion in total liquidity, comprising a cash position of $2.2 billion, short-term investments of $1.1 billion, and $400 million in revolver credit availability. Total liquidity decreased by $818 million sequentially. Note that short-term investments exclude $3.4 billion related to the Central Bank of Brazil's mandatory guarantee. Our total liquidity calculation excludes MELI’s $1.3 billion in restricted cash as of September 2024 (June 2024: $1.0 billion), a mandatory reserve under various central bank regulations.
As of September 2024, MELI’s total liquidity covered short-term debt by 1.5x, down from 1.9x in June 2024 (December 2023: 1.7x). Short-term debt includes $680 million in bank loans, $1,058 million in deposit certificates, and $390 million in collateralized debt for credit origination funding.
Recent News
Fitch Upgrades MELI’s Issuer Default Ratings to Investment Grade, BBB-
MELI has been upgraded to investment grade status for the first time, with its IDRs raised to BBB- from BB+, with a stable outlook. The upgrade reflects MELI’s strengthened business and financial profile, which has been marked by consistent growth rates, market share expansion in recent years, larger scale, and increasing cash flow contributions from Mexico. MELI’s track record of combining growth and profitability, along with its diversification across multiple verticals, provides it with significant competitive advantages that are difficult to replicate. The upgrade also considers MELI’s robust financial flexibility, conservative capital structure, and positive long-term demand fundamentals for e-commerce, digital payments, credit, and advertising in Latin America.
MELI remains one notch below investment grade with both S&P Ratings and Moody’s, with S&P revising MELI’s outlook to positive in June. If either agency upgrades MELI’s credit rating to investment grade, we anticipate a technical bid driven by its inclusion in the investment grade index.
Disclaimer
Opinions presented in this report are based on and derived primarily from public information that EM Spreads LLC ("EM Spreads," "We," or "Our") considers reliable. Still, we make no representations or warranty regarding their accuracy or completeness. EM Spreads accepts no liability arising from this report. No warranty, express or implied, as to the accuracy, timeliness, completeness, or fitness for any particular purpose of any such analysis or other opinion or information is given or made by EM Spreads in any form.
All information contained in this document is protected by Copyright law, and none of such information may be copied, repackaged, transferred, redistributed, resold, or stored for subsequent use for any such purpose, in whole or in part, by any person without EM Spreads’ prior written consent. All rights reserved. Reproduction of this report, even for internal distribution, is strictly prohibited. The content shall not be used for any unlawful or unauthorized purposes.
This content is provided on an "as is" basis and should not be regarded as a substitute for obtaining independent advice. EM Spreads disclaims all express or implied warranties, including, but not limited to, any warranties of merchantability or fitness for a particular purpose or use, freedom from bugs, software errors, or defects, that the content’s functioning will be uninterrupted or that the content will operate with any software or hardware configuration. Investors must determine the appropriateness of an investment in any instruments referred to herein based on the merits and risks involved, their own investment strategy, and their legal, fiscal, and financial position. As this document is for information purposes only and does not constitute or qualify as an investment recommendation or advice or as a direct investment recommendation or advice, neither this document nor any part of it shall form the basis of or be relied on in connection with or act as an inducement to enter, any contract or commitment whatsoever. Nothing in this report constitutes investment, legal, accounting, or tax advice or a representation that any investment or strategy is suitable or appropriate to your individual circumstances or otherwise a personal recommendation to you.
The opinion contained in this report may not be suitable for your specific situation. Investors are urged to contact their investment advisors for individual explanations and advice. EM Spreads does not offer advice on the tax consequences of investments, and investors are urged to contact an independent tax adviser for individual explanations and advice. In no event shall EM Spreads be liable to any party for any direct, indirect, incidental, exemplary, compensatory, punitive, special, or consequential damages, costs, expenses, legal fees, or losses (including, without limitation, lost income or lost profits and opportunity costs or losses caused by negligence) in connection with any use of this report.
This document may contain forward-looking statements that involve risks and uncertainties. Actual results may differ materially from those expressed or implied in such statements. EM Spreads undertakes no obligation to update any forward-looking statements to reflect events or circumstances after the date of this document or to discontinue it altogether without notice. EM Spreads reserves the right to modify the views expressed herein without notice.
The content in this report is provided to you for information purposes only. EM Spreads’ opinions and analysis are not recommendations to purchase, hold, or sell any securities or to make any investment decisions and do not address the suitability of any security. EM Spreads assumes no obligation to update the content following publication in any form or format. The content in the report shall not be relied on and is not a substitute for the skill, judgment, and experience of the user, its management, employees, advisors, and /or clients when making investment and other business decisions. EM Spreads has not taken steps to ensure that the securities referred to in this report are suitable for any investor.
This report is not directed to or intended for distribution to or use by any person or entity who is a citizen or resident of or located in any locality, state, country, or other jurisdiction where such distribution, publication, availability, or use would be contrary to law or regulation or which would subject EM Spreads to any registration or licensing requirement within such jurisdiction. No person should review or rely on this report if such review or reliance would require EM Spreads to obtain any registration or license in any such jurisdiction.
All estimates and opinions expressed in this report reflect the analysts' independent judgment as of the issue's date about the subject company or companies and its or their securities. No part of the analyst's compensation was, is, or will be directly or indirectly related to this report's specific recommendations or views. The research analysts contributing to the report may not be registered /qualified as research analysts with any regulatory or government body or market regulator.